WHERE DROUGHTS HIDE

Exploring drought patterns beyond the world's hottest and driest regions.

scroll
The question

Which one is in a
drought?

Both.

Despite a 5°C (41°F) difference in average temperature, both regions experience drought conditions.

Definition

What is drought?


Drought is not determined by how little precipitation a region receives. It is defined by how much precipitation falls relative to what is historically expected. A rainforest receiving half its normal rainfall may be experiencing drought, while a desert receiving its typical amount of precipitation may not.

Scientists measure these deviations using the Standardized Precipitation Index (SPI), a score that compares observed precipitation to a region's long-term average.

Concept

Drought beyond
hot climates.


Because drought is defined by precipitation deficit rather than heat, it can occur across many climate zones, including mountain ranges, temperate forests, grasslands, and Arctic regions.

An SPI value below −1 generally indicates drought conditions, regardless of whether the local climate is hot, temperate, or cold.

A comparison of two desert climates

Similar drought patterns,
different climates.

The Great Basin and Death Valley are located only four degrees of latitude apart in the western United States. Although Death Valley is considerably warmer, both regions show comparable drought behavior when evaluated using SPI.
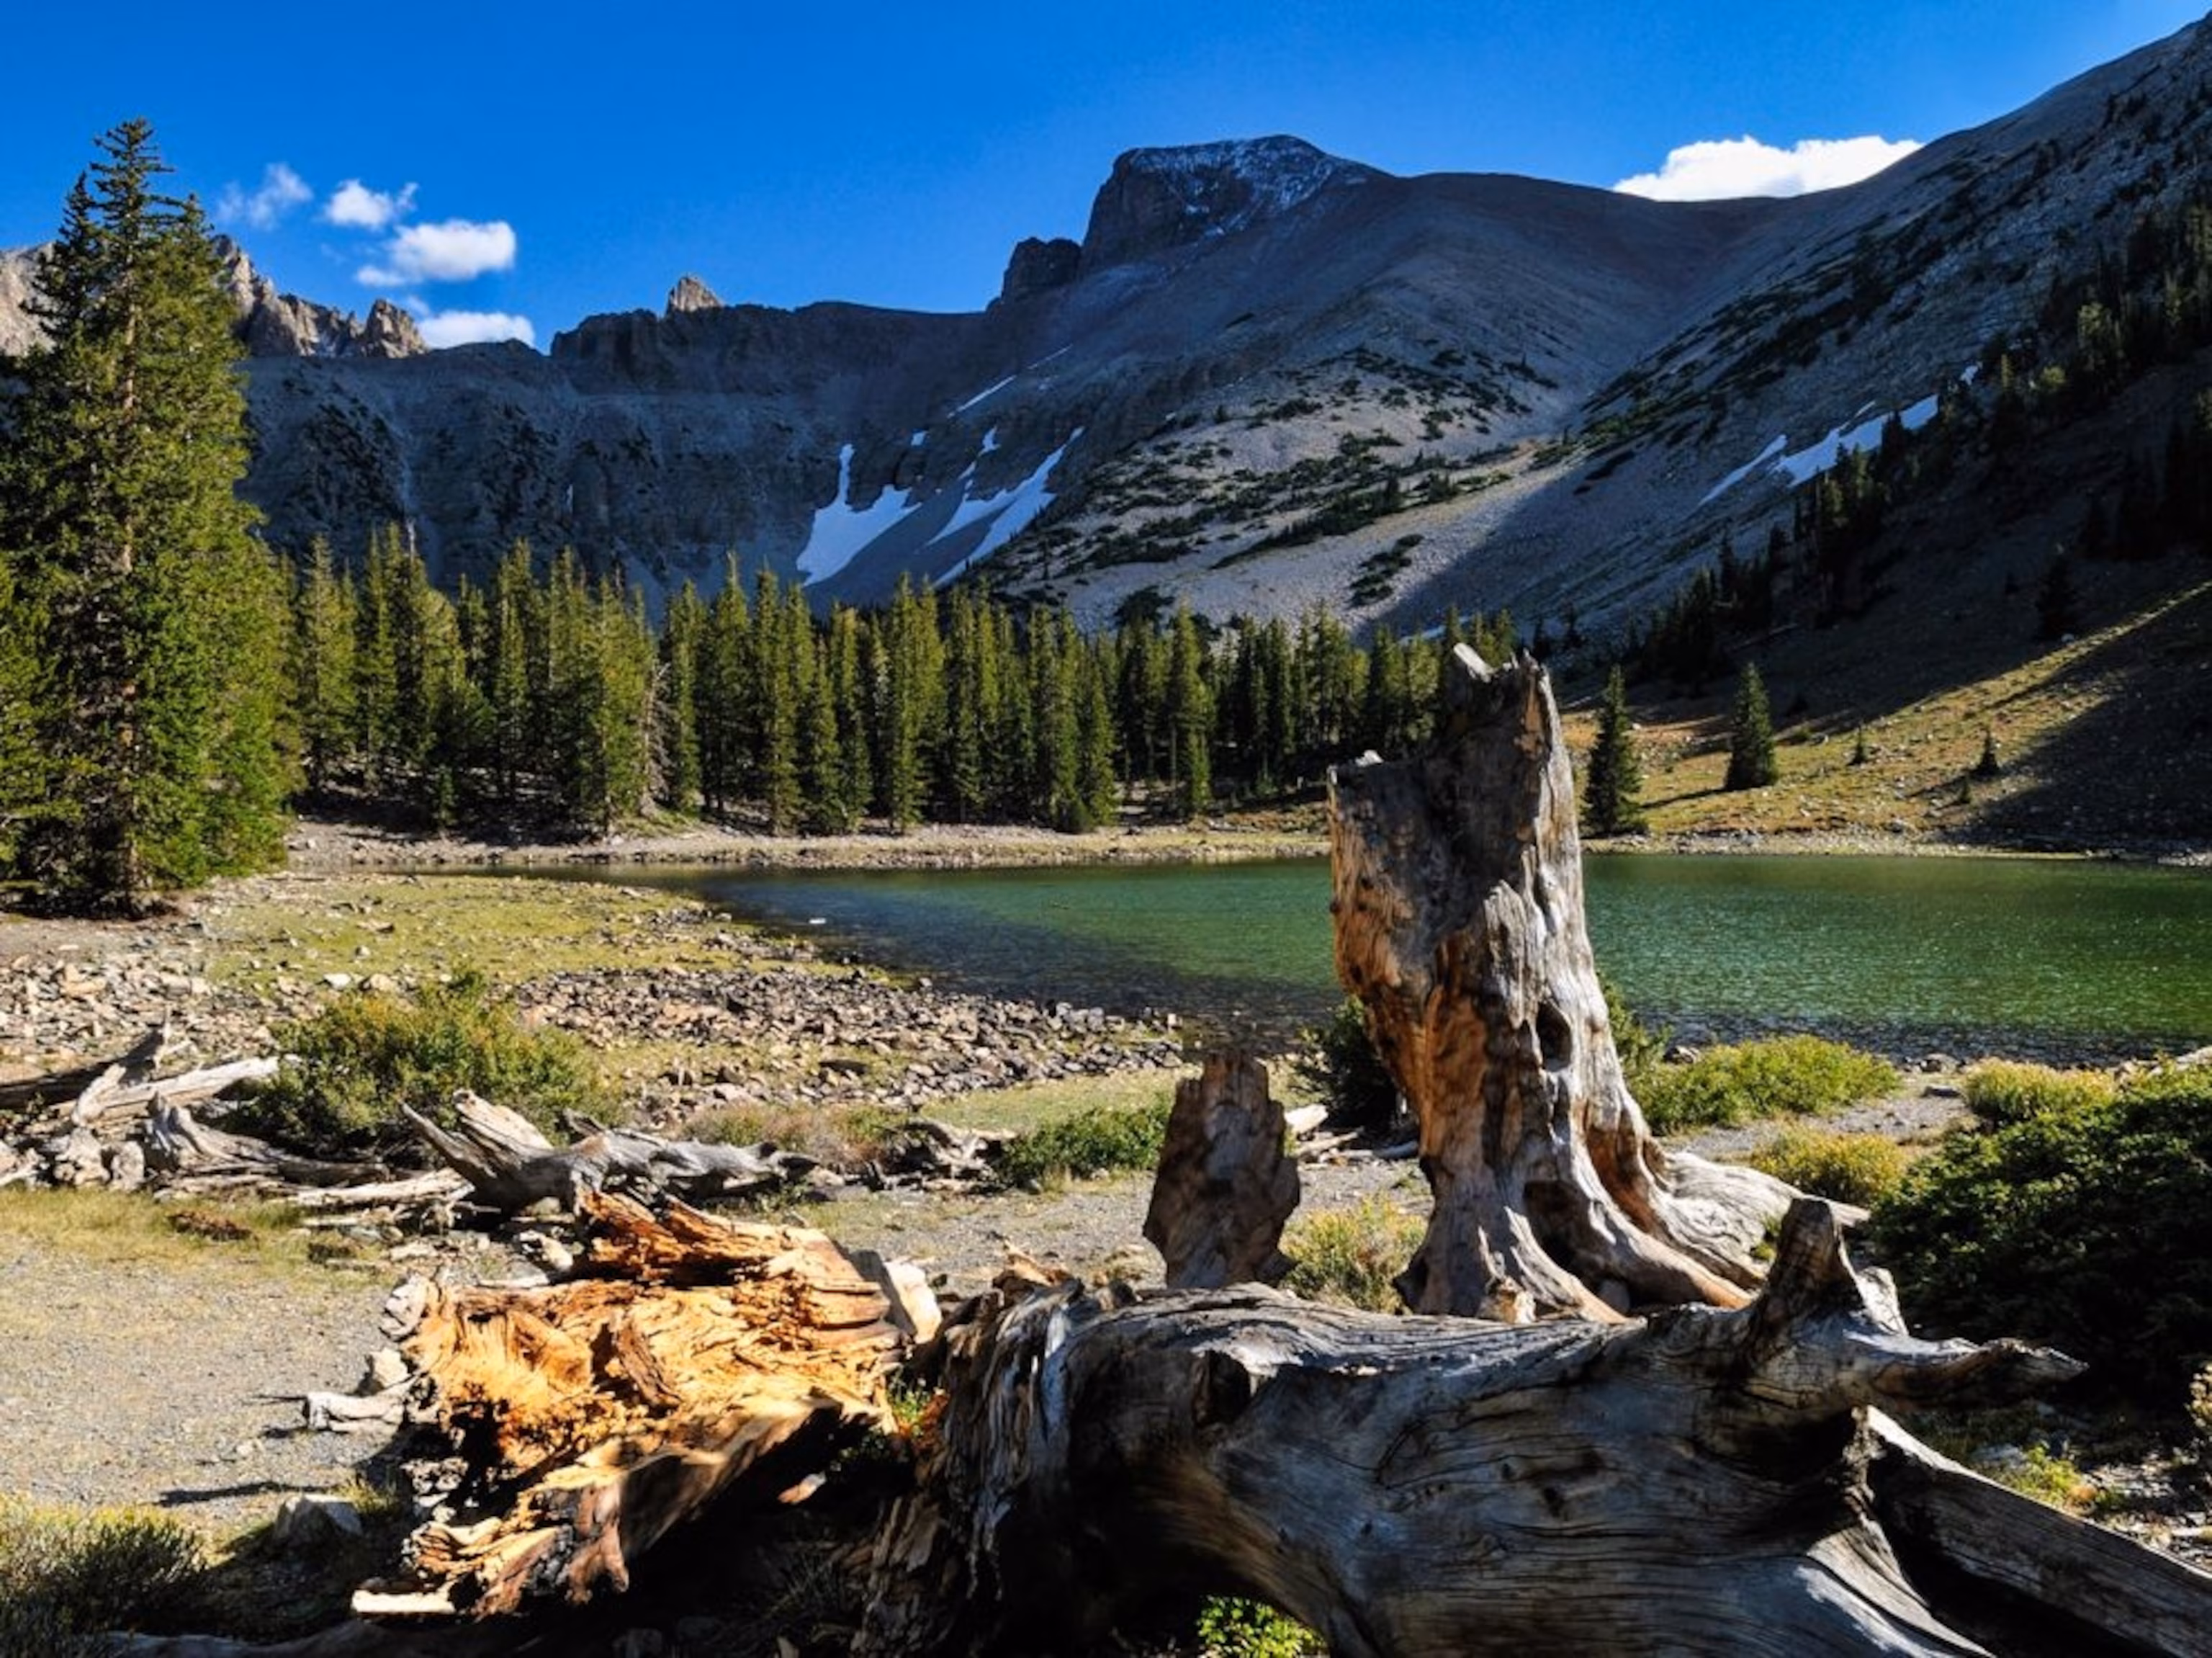
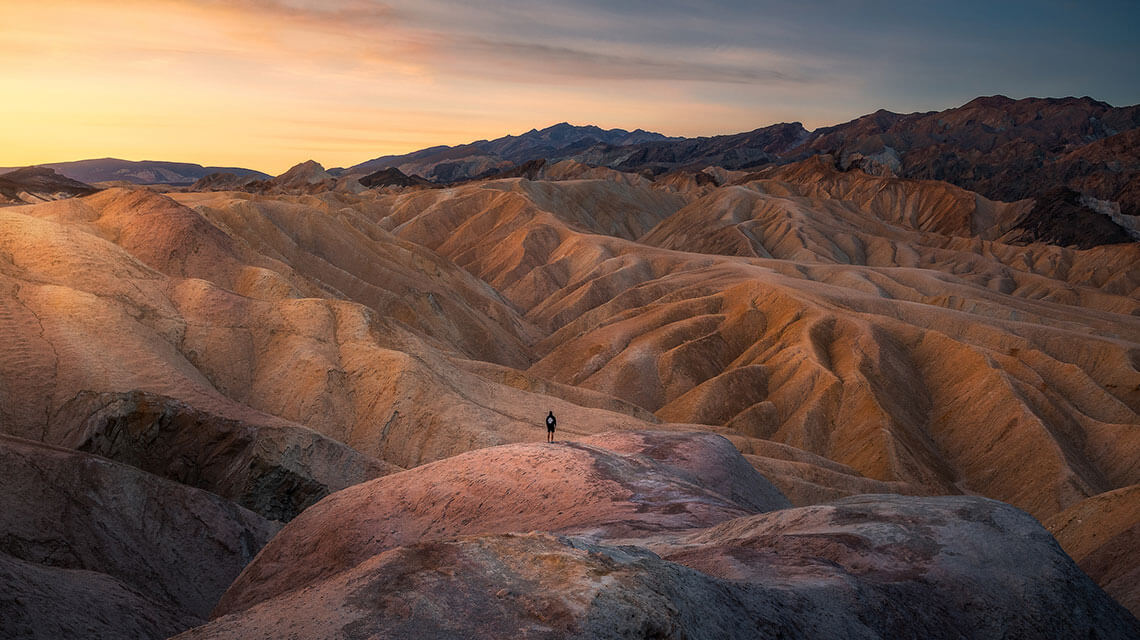
Great Basin desert landscape
Great Basin 40.67°N · 117.67°W Cold desert · 9.7°C mean
Death Valley desert landscape
Death Valley 36.46°N · 116.87°W Hot desert · 14.5°C mean

Chart 1 of 3

Climate
Profile


Death Valley is about 5°C warmer, yet monthly precipitation is nearly identical at approximately 22–24 mm/month. This suggests that temperature alone does not explain drought frequency.

Death Valley Death Valley — the hottest place on Earth

Chart 2 of 3

SPI-12
over Time


Both regions follow similar SPI patterns across 1950–2014. Their drought periods often occur at similar times, reflecting shared regional precipitation patterns across the American West.

Great Basin
Death Valley
SPI = −1.0 threshold
Great Basin Great Basin — cold desert, similar deficit

Chart 3 of 3

Drought
Frequency


Both regions share the same drought statistics in this dataset: 17.8% of months fall below SPI −1.0, and 3.0% fall below SPI −2.0. These results show that drought frequency is not determined by temperature alone.

17.8% months SPI < −1.0 both regions
3.0% months SPI < −2.0 both regions
Understanding the Standardized Precipitation Index (SPI)

Step 1

The baseline


An SPI of 0 means precipitation is equal to the long-term average for that region. There is no surplus or deficit. This value serves as the reference point for identifying wetter or drier conditions.

DryNormalWet

SPI = 0.0

Step 2

Above average


A positive SPI indicates that precipitation was above the historical average. An SPI of +1.0 represents moderately wet conditions, while +2.0 indicates unusually wet conditions that may increase flood risk.

DryNormalWet

SPI = 0.0

Step 3

Early warning signs


An SPI between −0.5 and −0.9 indicates below-average precipitation. These values may signal emerging dry conditions, although they are not typically classified as drought.

DryNormalWet

SPI = 0.0

Step 4

Significant drought


An SPI between −1.0 and −1.5 indicates moderate drought. At this level, a region has received substantially less precipitation than expected, which can affect streamflow, vegetation, and water availability.

DryNormalWet

SPI = 0.0

Step 5

Extreme drought


An SPI of −2.0 or below indicates extreme drought. These events are statistically rare and may be associated with severe water stress, ecosystem impacts, and longer recovery periods.

DryNormalWet

SPI = 0.0

Droughts across the globe

Temperature
Why this matters
News
[Breaking] Regional report: Central Asia's Amu Darya and Syr Darya rivers face unprecedented flow reductions — experts warn of "permanent water stress" by 2030
[Energy] Bishkek: Kyrgyzstan struggles with critical water levels at Toktogul Reservoir, threatening hydroelectric output for millions during winter peak
[Agriculture] Tashkent: Uzbekistan cotton and grain sectors hit by severe low-water periods as alpine glacial melt runs dry earlier each season
[Security] Caspian Sea: water levels drop to near-historic lows — satellite data reveals hundreds of square miles of exposed seabed from upstream river deficits
[Trade] European Alps: winter snowpack deficits trigger summer shipping halts — Rhine River levels dip too low for commercial barges
[Ecology] Kazakhstan declares state of emergency in western districts as steppe grazing lands dry out, devastating local livestock populations

Why this matters

How this affects us

When a hot desert experiences a dry spell, the local infrastructure is already built for it. But when a cold, temperate, or high-altitude region slips into a persistent precipitation deficit, communities become vulnerable to unexpected climate events. Hidden droughts strike the places least prepared for them.

Food security

Threat to Our World's Grain

Temperate grasslands and continental interiors like Central Asia or the US Midwest grow the majority of the world's grain. A seemingly mild 15% drop below historical precipitation averages is enough to trigger global food price spikes and export bans.

Energy

Green Energy is at Risk

Many cold and mountainous regions rely on winter snowfall to drive hydroelectric power. When cold droughts hit, alpine reservoirs dry up. Countries transitioning to green energy are suddenly forced back to coal and gas just to keep the lights on.

Geopolitics

Lack of Government Policies

Because these droughts don't "look" like a natural disaster, political responses are slow. Water-sharing agreements signed decades ago based on historical baselines are collapsing, turning river basins into geopolitical flashpoints.

~60%of global grain from cold-temperate zones
15%precipitation drop can trigger food price spikes
2030projected permanent water stress in Central Asia
Try it yourself

BUILD YOUR OWN CLIMATE

Adjust temperature and precipitation to compare climate profiles across countries.

ColdModerateHot
DryModerateWet

DROUGHT RISK

LOW MOD HIGH V.HIGH

YOUR CLIMATE IS MOST SIMILAR TO:

Loading...

Country-level drought trends

How Does Your Country Rank?

FIND YOUR COUNTRY

Spin the globe and click a country to view its drought rank, SPI trend, and historical record.

↓ Most Worsening

    ↑ Most Improving

      Drag to spin · Scroll to zoom · Click a country
      Scroll to zoom
      Conclusion

      The bigger picture

      Drought doesn't hide.
      It goes unnoticed.

      For decades, drought response has followed a simple rule: look where it's hot and dry. But SPI data tells a different story. The precipitation deficits now threatening global food supply, hydroelectric grids, and water-sharing agreements aren't only in the Sahara. They're in Kazakhstan. In Patagonia. In the American West. In places that don't look like they're in trouble — until they are.

      Every water treaty, every reservoir target, every crop insurance policy is calibrated to a historical baseline. SPI shows that baseline is shifting fastest in the places least expected. And because these regions don't look like deserts, the warning signs go unread until the damage is done.

      The data exists. The patterns are visible.
      The question is whether the right systems are looking at them.